Stock Predictions problem in Hackerrank is listed as easy and surprisingly I struggled a lot to get a decent score. I hope to learn a little more about the investment strategies that actually work in real life and nail this problem. As of now, I will post what the problem says and my logic to get a solution in R and score 58.8 with the hidden test cases.
Problem:
We start with some money, mentioned in the input data. Each turn we are given the stock prices of the current day and the previous 4 days. We then choose to BUY or SELL the stocks or do NO transactions at all to gain maximum profit at the end of d days(Input). The program will run with input for 1 day at a time.
Input Format:
The input of each turn consists of multiple lines.
The first line contains three space-separated numbers mkd.
- m – the amount of money we could spend that day.
- k – the number of different stocks available for buying or selling.
- d – the number of remaining days for trading stocks.
Then k lines follow, each in the following format: name, owned and prices.
- name – the name of the stock (a string).
- owned – the number of shares we own of that stock.
- prices – 5 space-separated numbers representing the stock’s price for the last 5 days. These are ordered from oldest to newest, so the last number is the current stock price.
Output Format:
- Output N for the number of transactions we wish to do. Output 0 if we are not doing any transactions that day.
- If we are doing transactions, output N lines containing the name of the stock (case sensitive), BUY or SELL, and the number of shares we want to buy or sell.
Solution:
I usually work in RStudio since it helps me to debug and print messages. Once I am happy with my solution, I try it in the HackerRank Editor. So, I have used the two below test cases as input in RStudio. But, the only problem in RStudio is we have the data for the first day only. In HackerRank Editor, while playing the game, for each day, a new Stock value is added for each row and the oldest value gets removed. So, for each day, we have 5-day prices. Well, it took me some time to figure out the information itself.
Let me explain the first input file.
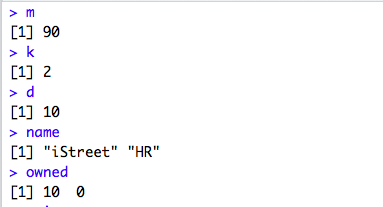
We got 90$ and 2 stock information and 10 days to play.
m=90$
k=2
d= 10
Now, for “iStreet“, we have 10 stocks on hand and the prices for the last 5 days, 120.58 being the latest or today’s price. For “HR”, we do not have any stock as of now and 17.50 is today’s price.
Let’s start with the code part and then later I will explain part by part.
Code1: readInputandRun:
This Function reads the input data and then finally prints the transactions. In Hackerrank Editor we need to read the data using “stdin”.
readInputandRun<- function()
{
  #### Hackerrank Editor Read Input - Start
  #stdin <- file('input')
  #open(stdin)
  #input <- readLines(stdin,  warn=FALSE)
  #close(stdin)
  #### Hackerrank Editor Read Input - End
  # Read Input in RStudio - Start setwd("/Users/oindrilasen/WORK_AREA/DataScience/HackerRank/StockPrediction")
  input <- readLines("input1.txt", warn = FALSE)
  # Read Input in RStudio - End
  input = unlist(strsplit(input, split = "n"))
  input = unlist(input)
  # read the first line
  tmp <-  strsplit(input, split = " ")[1]
  m <- as.numeric(sapply(tmp, "[[", 1))
  k <- as.numeric(sapply(tmp, "[[", 2))
  d <- as.numeric(sapply(tmp, "[[", 3))
  line <- c()
  name <- c()
  owned <- c()
  prices <- c()
  for (i in 1:k) {
    line[i] <- as.vector(strsplit(input, split = " ")[i+1])
    name <- c(name, as.character(sapply(line[i], "[[", 1)))
    owned <- c(owned , as.numeric(sapply(line[i], "[[", 2)))
    prices[[i]] <- as.list(unlist(line[i])[3:7])
  }
  printTransactions(m, k, d, name, owned, prices)
}
Now, let’s see how the testcase1 looks like at this point.
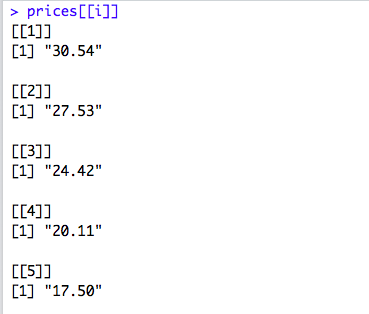
Prices are a list of prices for the two stocks. Let’s check the prices for the first stock “iStreet“.
We need some parameters to decide whether to BUY a stock or to sell a stock. My first approach was quite simple.
Next, I have used a Weighted Moving Average(WMA) and that made a little more sense than the first approach. So, what is WMA, and why it is any useful?
WMA is a method of computing a kind of arithmetic mean of a set of numbers in which the latest elements of the set carry more importance (weight) than others. That means the latest prices of the stock have more weights than the previous prices. It can be calculated by the below formula:
}{2}}")
Code2:calcWma:
I have used the previous 4 days prices to calculate the WMA. Let’s create one function to calculate the Weighted Moving Average.
calcWma <- function(k,prices,d){
  wma <- c()
  a <- 0
  for (i in 1:k) {
    for (j in 1:4){
      a <- a + (as.numeric(prices[[i]][[j]]) * j)
    }
    b <- ((j * (j+1))/2)
    wma[i] <- round(a/b,2)
    a <- 0
  }
  return(wma[d])
}
Now, let’s take a look at the Weighted moving average for the first record.

In a more mathermatical way, it is calculated as below:
numerator: ((4.54 * 1) + (5.53 * 2) + (6.56 * 3) + (5.54 * 4)) = 57.44
denominator: (4 * (4 +1)/2) = 10result : 57.44/10 = 5.74
Finally, comes the part where we are using the data and the WMA to decide whether to SELL a stock or BUY one and print that transaction.
Code3: printTransactions:
The function’s flow is like below:
loop through the stocks
↓
check the difference between today’s price and wma( get “f”)
↓
calculate the minimum of “f”
↓
(Finally, if there are more than one stocks whose prices has dropped, BUY the one which has dropped maximum)
Code:
 printTransactions <- function(m, k, d, name, owned, prices){
  trx_count <- 0
  stock_name <- c()
  stock_num <- c()
  trx <- c()
  m1 <- 0
  f <- c()
  for (i in 1:k) {
    f[i]  <- as.numeric(prices[[i]][[5]]) - calcWma(k,prices,i)
  }
  minF <- min(f)
  for (i in 1:k) {
    if (owned[i] > 0 &
        as.numeric(prices[[i]][[5]]) > calcWma(k,prices,i)
    ) {
      trx_count = trx_count + 1
      stock_name <- c(stock_name,as.character(name[i]))
      trx <- c(trx, "SELL")
      stock_num <- c(stock_num, owned[i])
      m1 <- m1 + owned[i] * as.numeric(prices[[i]][[5]])
      #print("SELL")
      #print(m1)
      owned[i] <- owned[1] - stock_num[trx_count]
      #print(owned[i])
    }
    else if ( as.numeric(m) > 0 &
              floor(as.numeric(m) / as.numeric(prices[[i]][[5]])) > 0 &
              f[i] == minF
    ) {

      trx_count = trx_count + 1
      stock_num <- c(stock_num, floor(m /as.numeric(prices[[i]][[5]])))
      stock_name <- c(stock_name,as.character(name[i]))
      trx <- c(trx, "BUY")
      owned[i] <- stock_num[trx_count]
      m <- m - as.numeric(stock_num[trx_count] * as.numeric(prices[[i]][[5]]))

    }
  }
  m <- (m + m1)
  m1 <-0

  if (trx_count > 0) {
    cat(trx_count, sep = "n")
    for (i in 1:trx_count) {
      cat(stock_name[i], trx[i], stock_num[i])
      cat(sep = "n")
    }
  }
  if (trx_count == 0){
    cat(trx_count, sep = "n")
  }
}
So, it is all done! The final part is to call the function readInputandRun() and check how it works.
readInputandRun()
We can run the same code for testcase2 and see the results.
Output for testcase1:

Output for testcase2:

And, Output at Hackerrank for Sample Testcase:

Well, that was fun!
Thank You for reading!
2