In my last post, I worked on connecting Twitter and collecting tweets on #Corona using Tweepy. So now that we have collected some tweets, let’s work on cleaning and analyzing those text step by step.
1. Import Libraries
Let’s import all the required libraries first.
import twitter
import tweepy as tw
# For Preprocessing
import re
from nltk.tokenize
import word_tokenize
from nltk.corpus import stopwords
set(stopwords.words('english'))
from wordcloud import WordCloud
# ForPlots
import matplotlib.pyplot as plt
2. Initialize and Connect twitter
Now, let’s connect to twitter account using the respective key and access token.
# initialize api instance
consumer_key='################'
consumer_secret='######################'
access_token='############################'
access_token_secret ='#####################'
#Connect to Twitter through the API
auth = tw.OAuthHandler(consumer_key, consumer_secret)
auth.set_access_token(access_token, access_token_secret)
api = tw.API(auth,wait_on_rate_limit=True)
3. Collect Tweets:
Now that we are connected to twitter, we will look for English Tweets on #Coronavirus.
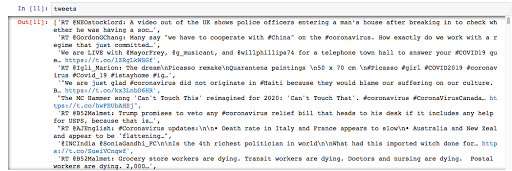
Let’s collect 1000 tweets and work on Text Analytics.
The variable Tweets is a list object containing all the text and links and emojis and pictures, etc.
4. Cleaning and Preprocessing:
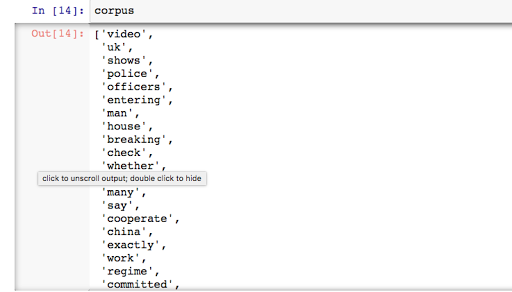
Now, we need to clean all the tweets to extract some meaningful words. We will create a corpus by passing the tweets to the function.
Mystopwords = ["AT_USER","URL","rt","corona","coronavirus","covid","amp","new","th","along","icai","would","today","asks"]
corpus = clean_tweets(tweets)
5. Text Analytics:
We have a corpus and we can work on some basic Text Analytics techniques. First, let’s take a look at how the corpus looks like at this point.
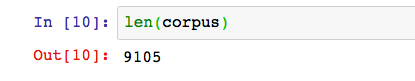
If we check the length of the corpus, the result is 9105 for this run.
Can we get a count of each distinct word from the Corpus? Let’s do it!
A. Frequency Distribution:
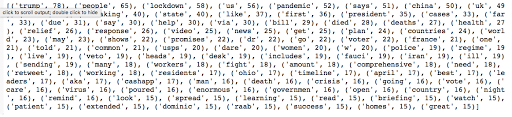
Our aim is to find out the frequency of each distinct word from the corpus. Then we will take a look at the most used terms.
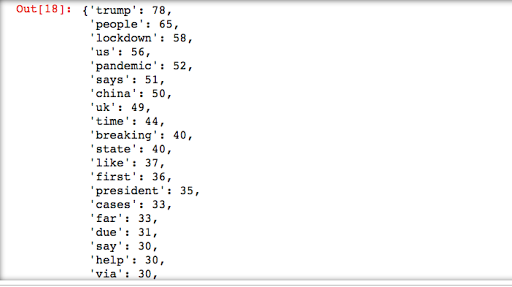
from nltk.probability import FreqDist
fdist = FreqDist(corpus)
print(fdist.most_common(100))
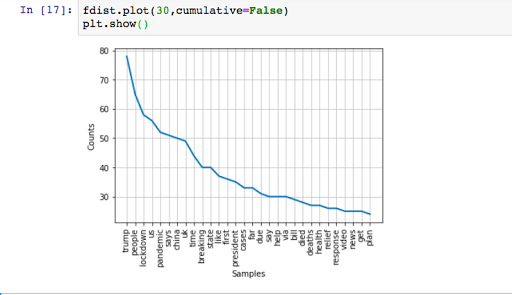
If I check my results, Trump is trending again.
Let’s plot 30 most used terms in today’s tweets on #coronavirus.
fdist.plot(30,cumulative=False)
plt.show()
Now, let’s try some other tools. For visuals, my most favorite is Wordcloud.
B. Wordcloud:
Before creating the word cloud, let’s check the frequency count in a different way.
import operator # To sort dictionary values
# join the words in string
words = ' '.join(corpus)
words = words.split()
#print(words)
# create a empty dictionary
data = dict()
# Get frequency for each words where word is the key and the count is the value
for word in (words):
word = word.lower()
data[word] = data.get(word, 0) + 1
# Sort the dictionary in reverse order to print first the most used terms
dict(sorted(data.items(), key=operator.itemgetter(1),reverse=True))
Again as expected, the output shows that Mr. Trump is most frequently used in Tweets. Now, let’s create a word cloud with 100 most used words.
word_cloud = WordCloud(width = 800, height = 800, background_color ='white',max_words = 100)
word_cloud.generate_from_frequencies(data)
# plot the WordCloud image
plt.figure(figsize = (10, 8), edgecolor = 'k')
plt.imshow(word_cloud,interpolation = 'bilinear')
plt.axis("off")
plt.tight_layout(pad = 0)
plt.show()
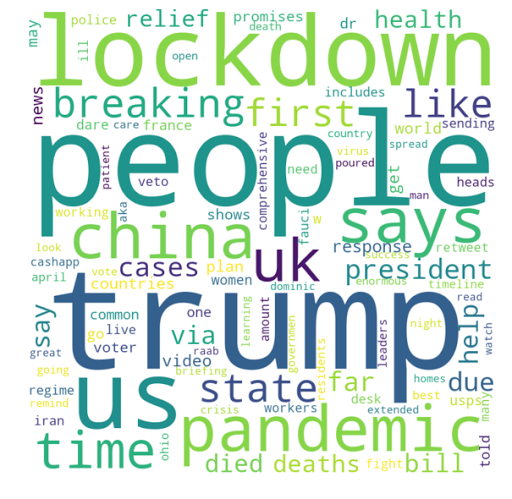
Okay, Trump, Lockdown, Pandemic – that pretty much sums up the current trend in the whole world! Next, I will try to figure out the people’s sentiments during this crisis period and will work on Sentiment Analysis using Tweets on #coronavirus.
Till then… stay safe!
2