I am in love with Tweepy! There are so many amazing things we can do using Tweepy!
In my last post, I tried the search() method to look for some hashtags from Twitter. This method looks for the history data on twitter.
Then, I worked on some basic Text Analytics on #coronavirus trends. My sister saw that post and got curious if we could create a similar wordcloud on Tweets from India. Why not?
In this post, we will work on the below topics:
A. Streaming from Twitter
B. Basic text Analytics
A. Streaming:
Streaming allows us to actively watch for tweets that match certain criteria in real-time. Interesting right? This means that when there aren’t any new tweets matching the criteria, then the program will wait until a new tweet is created and then process it. This Tweepy Documentation has all the details on streaming.
Now, as per the documentation, to use the streaming API, we need to follow three steps.
- Create a class inheriting from StreamListener
- Using that class, create a Stream object
- Connect to the Twitter API using the Stream.
Here’s how it worked for me.
1. Import Libraries:
Let’s import all the required libraries first.
# Import Libraries
from twitter import *
import tweepy
from tweepy.streaming import StreamListener
from tweepy import OAuthHandler
from tweepy import Stream
##
import csv
from datetime import datetime
import time
from requests.exceptions import Timeout, ConnectionError
from requests.packages.urllib3.exceptions import ReadTimeoutError ##
import ssl
## Preprocessing
import pandas as pd
import re
from nltk.tokenize import word_tokenize
from nltk.corpus import stopwords
set(stopwords.words('english'))
from wordcloud import WordCloud
## Plt
import matplotlib.pyplot as plt
2. Initialize and connect to Twitter:
Now, let’s connect to twitter account using the respective key and access token. The details of creating a Twitter Developer account and acquiring access token are here in one of my previous posts.
# initialize api instance
consumer_key='################'
consumer_secret='######################'
access_token='############################'
access_token_secret ='#####################'
#Connect to Twitter through the API
auth = tw.OAuthHandler(consumer_key, consumer_secret)
auth.set_access_token(access_token, access_token_secret)
api = tw.API(auth,wait_on_rate_limit=True)
3. Create a StreamListener:
The on_data method of Tweepy’s StreamListener passes data from statuses to the on_status method. So, we need to create class MyStreamListener inheriting from StreamListener and overriding the on_status method.
Here, we are modifying the on_status() method to do the following:
– get the text from the tweet object
– save the keyword
– save the other information like user, user location(if provided), time of the tweet and sources like android or iPhone or Web
– write all these details on a CSV file
Handling Errors:
When using Twitter’s streaming API, if it exceeds a limited number of attempts to connect to the streaming API in a window of time, then we will receive error 420. The amount of time we need to wait after receiving error 420 will increase exponentially each time we make a failed attempt.
That’s why we can override the on_error() method to handle status_code = 420.
Let’s create the MyStreamListener class.
4. Connecting Twitter and Start Streaming
We will create a function and will do the following steps:
- Open a CSV file and write the header row
- Create a stream using the class created above
- Pass the keywords and start the stream. I have passed language as “English” to get only English tweets.
- Will add a few exceptions so that streaming starts again after waiting for 15 minutes
Here, I was trying to stop streaming when I have enough data for Text Analysis. I work on the Jupyter Notebooks and wanted to use “Interrupt the Kernel” to stop streaming. I have used the KeyboardInterrupt exception for this purpose. So, let’s write a function to create a stream object and connect to Twitter API for streaming.
5. Search for hashtags
Finally, let’s pass the hashtags and call the above function to start streaming. Since I am working on getting tweets from India on coronavirus, I have used the below tags:
‘#IndiaFightsCorona’, ‘#IndiaSpreadingCovidRacism’, ‘#lockdownindia’, ‘#coronavirusinindia’
if __name__ == '__main__':
# Setting up the keywords, hashtag or mentions we want to listen
keywords = ['#IndiaFightsCorona', '#IndiaSpreadingCovidRacism', '#lockdownindia', '#coronavirusinindia']
filename = "tweets"
### Call Function to start streaming
start_streaming()
So, on executing the above step a CSV file is created and data started to get dumped in there. When I collected enough data, I stopped the kernel to read the CSV file and do some basic text analytics.
Text Analytics:
I will keep the text analytics part simple and straightforward in this post. We will follow the below steps:
- Open the CSV file in a pandas dataframe and read the tweets
- Create a function where we will pass the tweets data and it will return a clean corpus of words.
- Check frequency distribution of each word in the corpus and create a wordcloud using those words
1. Read the tweets
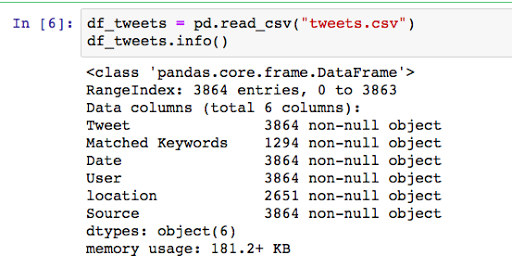
Let’s take a look at the CSV file, created above by streaming tweets.
df_tweets = pd.read_csv("tweets.csv")
df_tweets.info()
If we check df_tweets.head(), we can see the first 5 records as below:
2. Clean the tweets
Now, let’s clean the tweets and work on some basic text analytics. We will use the same function created on my last post for cleaning and preprocessing.
Mystopwords = ["AT_USER","URL","rt","india","indiafightscorona","corona","coronavirus","coronavirusinindia","lockdown","covid","_","amp","ji","one","people","see"]

corpus = clean_tweets(df_tweets.Tweet,Mystopwords)
3. Check Frequency Distribution
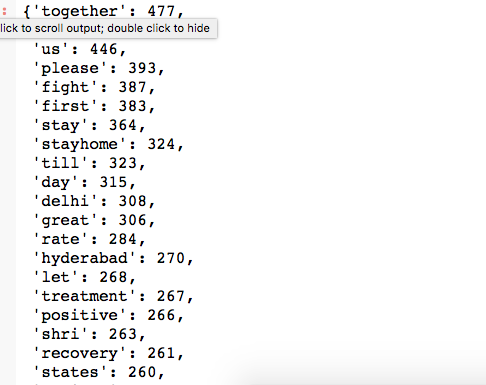
Let’s take a look at the frequency of each word found in the corpus.
import operator

# To sort dictionary values# join the words in string
words = ' '.join(corpus)
words = words.split()
#print(words)
# create a empty dictionary
data = dict()
# Get frequency for each words where word is the key and the count is the value
for word in (words):
word = word.lower()
data[word] = data.get(word, 0) + 1
# Sort the dictionary in reverse order to print first the most used terms
dict(sorted(data.items(), key=operator.itemgetter(1),reverse=True))
4. Create wordcloud
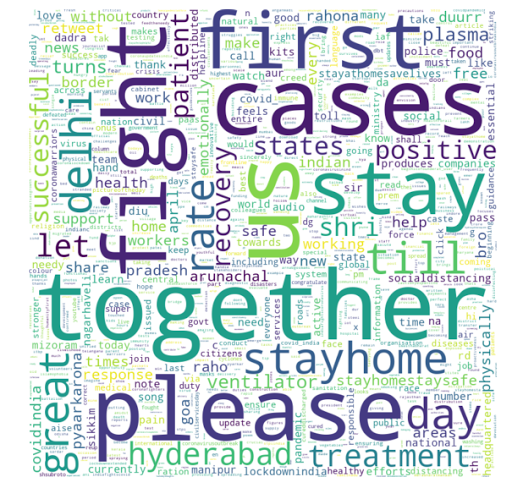
Finally, let’s create a wordcloud and take a look at the picture.
word_cloud = WordCloud(width = 800, height = 800, background_color ='white',max_words = 1000)
word_cloud.generate_from_frequencies(data)
# plot the WordCloud image
plt.figure(figsize = (10, 8), edgecolor = 'k')
plt.imshow(word_cloud,interpolation = 'bilinear')
plt.axis("off")
plt.tight_layout(pad = 0)
plt.show()
As expected, all the terms of the hour are highlighted. The entire code is at my Github.
Interestingly, when I was looking for the Twitter trends in India, I got some fascinating findings. How to find Twitter Trending Topics?
Stay Tuned, Stay Home, Stay Safe!
0 


