Text Analytics is an interesting but tricky subject. It is not easy to decipher sentiments from some words. It gets complex since we, people are so good at sarcasm. So, let’s take some baby steps and try to reach our goal.
I started with the Kaggle competition “Sentiment Analysis on Movie Reviews” and was lost. So, I just worked on creating a word cloud in R. Now, in this post, I will try to analyze some phrases and thus work with some sentiments. Let’s get started!
1.Data:
The dataset files, provided in Kaggle are .tsv files. My baby steps were stuck right there while loading the Data files in “.tsv” format. Well finally, I fixed the errors and loaded the files. Well, if you are also stuck, then my post regarding the errors and the solution is here.
There are two data files and they contain phrases from the Rotten Tomatoes dataset.
- train.tsv contains the phrases and their associated sentiment labels.
- test.tsv contains just phrases. We need to assign a sentiment label to each phrase.
The sentiment labels are:
0 – negative
1 – somewhat negative
2 – neutral
3 – somewhat positive
4 – positive
2.Load the data:
First, I have loaded the Training file alone. The .tsv datafile is loaded with read.delim. There are total of 156060 observations and 4 variables in the training data file.
Now, Let’s take a look at the different Sentiments and the record count for each Sentiment.
So, there are 5 unique sentiments as stated above. But, the data is not equally distributed.
3.Plot the Data:
Some visual data analysis always provides a basic understanding of the data, we have in the dataset. So, Plot time!
It seems like the majority of the data are of neutral sentiments. There are quite a few records for Negative or Positive Sentiments.
4.Create Document -Term-Matrix:
I already did a post before for creating a document-term-matrix and hence a word cloud and it is here.
Here, let’s build a function to create a document-term-matrix.
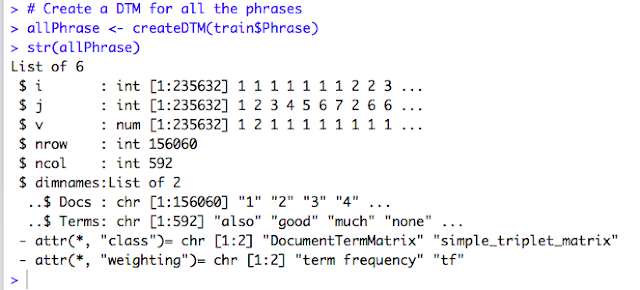
A corpus or text corpus is a large and structured set of texts which are used to do statistical analysis and hypothesis testing. In this case, we want to classify the Text in different sentiments. Now, let’s use the function created above and create a corpus for the “Phrase” column in our data.
Above, we are doing the following:
1. We are using the function “createDTM” to create a document-term-matrix for the Phrase column in our data set. If we check the structure of the object created, it is a “list” of 6 items. The last item “dimnames” is another list of 2 items “Docs” and “Terms”. After using sparse, 592 distinct terms are identified as mostly used words.
2. We are converting the list object created above into a Data Frame of 156060 observations and 592 variables where all those words that are identified as “mostly used” are considered as new features. We will use these features for building a Model later.
3. Then we merge this newly created data frame with the original “Train” dataset. So now, we have 156060 observations with 595 variables as below:
4. Finally, we remove the “Phrase” variable because it is no more required.
5.Create a Model For Prediction
This was and still is the real challenge. I tried Neuralnet, ramdomForest, DecisionTree and each of them is either erroring out or my rstudio is closing abruptly, or the model is building for a whole day and I had to terminate it manually.
Finally, I tried Multinomial Regression. Though the result is not satisfactory, at least I got a Model and it is quite simple.
The model was ready in a few minutes and it converged.
6.Prediction
This is the test for the model created. We had divided the training data into train and test dataset. So, now we will use the test set created above and predict the Sentiment Level. Then, we will compare with the actual Sentiment level for the corresponding data.
So, for the random number 567, the actual sentiment level and predicted sentiment level is the same. Not bad!
Now, let’s check the accuracy.
The accuracy of the Model is only 56% which is not so good. Hmmm, so what next? Maybe a different Machine Learning algorithm or a different approach to this problem?
I need to work on this a little more and I will share once I get a better model. Till then, keep learning.
Thank You!


