Problem:
Create an Exploratory Plot in R
Solution:
Data Visualization is communicating the data in a graphical format. We can create our first plot in R using the plot() function.
If you have any questions on how to get some sample dataset to play around, you can check in one of my previous post here. For this Example, we can use the MASS library and create an Exploratory plot from the data frame “whiteside“. If we check the structure of this Dataframe using str() function, we will see that it has 56 observations for three variables:
1 Create an Exploratory Plot in R
Solution:
Data Visualization is communicating the data in a graphical format. We can create our first plot in R using the plot() function.
If you have any questions on how to get some sample dataset to play around, you can check in one of my previous post here. For this Example, we can use the MASS library and create an Exploratory plot from the data frame “whiteside“. If we check the structure of this Dataframe using str() function, we will see that it has 56 observations for three variables:
1. Insul: A Factor Variable with 2 Levels -“Before” and “After” indicating whether the measurements were made before or after an insulation upgrade was made to the house.
2. Temp: A Number Variable indicating a measure of the outside temperature during one week
3. Gas: A Number Variable indicating the amount of heating gas consumed during that week
So, if we just type plot(whiteside), we will get a plot array.
We will get an absolutely different result if we apply the same function on the Categorical Factor Variable “Insul”.
Also, we can plot the Temp variable Vs Gas and the output is again different.
Code:
 |
| whiteside plot array |
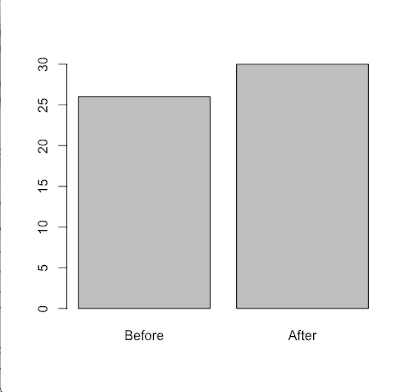 |
| whiteside$insul plot |
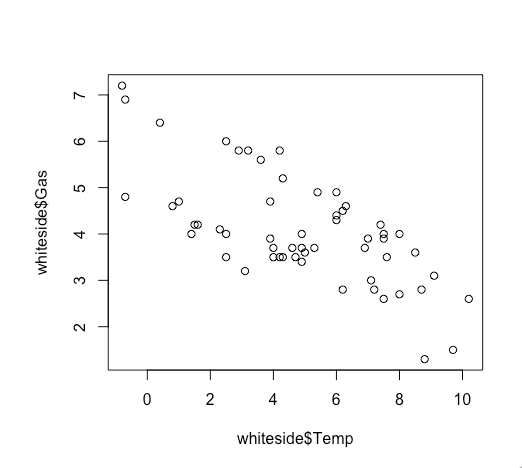 |
| Temp vs Gas Plot |