R – Plot Image of Digits from a Pixel Matrix

I was trying my hands on the Digit Recognizer Competition in Kaggle and I was paralyzed. Actually, I was not able to understand how to proceed with this. Then, I took a few deep breaths and told myself “one step at a time”.

So, the first step is to understand the data in the training set.
The dataset contains gray-scale images of hand-drawn digits, from 0 through 9. The training dataset (train.csv) has 785 columns. The first column, called “label”, is the digit that was drawn by the user. The rest of the columns contain the pixel values of the associated image. The image is of 28*28 i.e. 784 pixels. This pixel value is an integer between 0 and 255.

Now, let’s plot an image using the pixel value, and let’s see if it matches with the “Label” value.

Problem:
Plot an Image of a Pixel Matrix in R
Solution:
1. Let’s load the train.csv dataset and have a look.

So, there are 785 columns and 42000 rows.

The First column is “label” and the remaining columns are “pixel0”, “pixel1” and so on.
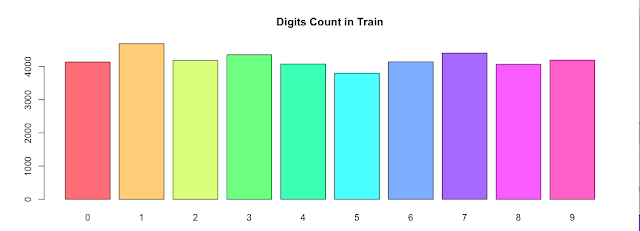
The “label” column has unique values from 0 – 9.

There are around 4000 records for each number.

Let’s plot the values.

2. Plot the pixel values
First, let’s try to figure out the first handwritten number. We will take the 1st-row values and will simply use the image() function to plot the values.

Is that a “1”? Well, that’s not so pretty. Okay, let’s write a loop to plot the first 6 numbers in the training Dataset.
Before that, let’s have a look at the first 6 “label” values.
In this loop, I will reverse and transpose each matrix to rotate images. Also, let’s use the Gray Scale for the plots.
Okay, so now, 6 label values are coming appropriately in the plots section, and here is the first one.
It would have been much better if we could have seen all the images together in a single place.
Let’s try a Function for this.

Here, I will use the par() function to query the existing graphical parameters. Let’s modify the parameter value for mar to set the number of lines of margin on the four sides of the plot and mfrow to set the size of the subsequent images.

Bingo! We finally got what we were looking for!

Thank You!
0

Leave a Reply

Your email address will not be published. Required fields are marked *