Decision Tree is a type of Supervised Learning where the sample is split into two or more homogeneous sets based on some significant splitter or differentiator in input variables.
The Decision that which ones of the Input Variables could be a Significant Splitter could affect a tree’s accuracy. A Decision tree uses multiple algorithms to decide to split a node into two or more sub-nodes.
Types of Decision Trees:
Classification Tree: The Model is to predict the CLASS to which the Data belongs.
Regression Tree: The Model is to predict a continuous target variable.
Important Terminology related to Decision Trees:
Root Node: The node that represents the entire population of Data and that will result in the subdivision of all records into two or more mutually exclusive subsets.
Decision Node: The Node that represents one of the possible choices available at that point in the tree structure.
Leaf Node/Terminal Node: The node that represents the final result of a combination of decisions or events.
Branches: Branches represent probable outcomes or occurrences that begin from root nodes and Decision nodes.
Splitting: It is a method of classifying a node into two or more sub-nodes.
Stopping: A complex Decision Tree Model where the records in each leaf/terminal Node is 100% pure (i. e. all records have the target outcome) would be overly fitted to the existing observations and will have a few records in each leaf node. So it could not predict the test cases accurately. To avoid certain scenarios, Stopping Rules can be applied to avoid overfitting and also underfitting.
Pruning: In some scenarios where Stopping Rues doesn’t work well, there is an alternative way to build a decision tree model. That is to grow a large tree first, and then remove some sub-nodes that provide less information to make the decision tree an optimal size. This process is called pruning.
Problem:
Create a Decision Tree Model in R
Solution:
To create our first Decision Tree Algorithm in R, we need to install “rpart” package.
install.packages("rpart")
Let’s follow the below steps to build our first Model:
1. Pick a Dataset:
For this example, we will use the same Titanic Dataset from Kaggle as we had used before for the Logistic Regression and Random Forest Example.
Below is a brief description of the Data:
|
Variable
|
Definition
|
Values
|
|
survival
|
Survival
|
0= No, 1 = Yes
|
|
pclass
|
Ticket class
|
1= 1st, 2= 2nd, 3= 3rd
|
|
sex
|
Sex
|
Male/Female
|
|
Age
|
Age in years
|
|
|
sibsp
|
No of siblings/spouses aboard the Titanic
|
|
|
parch
|
No of parents/children aboard the Titanic
|
|
|
ticket
|
Ticket number
|
|
|
fare
|
Passenger fare
|
|
|
cabin
|
Cabin number
|
|
|
embarked
|
Port of Embarkation
|
C = Cherbourg,
Q = Queenstown,
S = Southampton
|
2. Load Data:
First, we will Load the “Train.csv” and “Test.csv” Datafiles using the function read.csv(). While loading the Datafiles, we will use na.strings = “” so that the missing values in the data are loaded as NA.We will bind these 2 Datasets into one for further Data Cleaning.
3. Data Cleaning:
To keep this example simple, we are not going to add any new features. We will do the following cleanups instead:
- Remove a few variables which may not be beneficial for our analysis.
- Check for the NA values and replace the NA values with some meaningful data.
4. Create the Model:
5. Understanding the Model:

Each node shows:
- the predicted class, a binary response (died or survived),
- the predicted probability of survival,
- the percentage of observations in the node.
If we check the summary() function, we can see how the Decision Tree has used the variables for splitting.

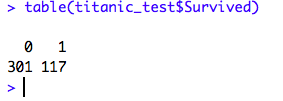
6. Predict Survival for the Test Dataset:
Now, let’s use the above Model to Predict Survival in the Test DataSet. To predict survival, we need to use the Predict() function.
Evan Raymonds
Decision trees are a great flow chart tree structure.Yet decision trees are less appropriate for estimation tasks where the goal is to predict the value of a continuous attribute.
To understand further more lets look at some Decision Tree Examples in the Creately diagram community.
akhilapriya404
I really enjoy the blog.Much thanks again. Really Great machine learning online training