Problem:
Solution:
1. Pick a DataSet:
|
Variable
|
Definition
|
Values
|
|
survival
|
Survival
|
0= No, 1 = Yes
|
|
pclass
|
Ticket class
|
1= 1st, 2= 2nd, 3= 3rd
|
|
sex
|
Sex
|
Male/Female
|
|
Age
|
Age in years
|
|
|
sibsp
|
No of siblings/spouses aboard the Titanic
|
|
|
parch
|
No of parents/children aboard the Titanic
|
|
|
ticket
|
Ticket number
|
|
|
fare
|
Passenger fare
|
|
|
cabin
|
Cabin number
|
|
|
embarked
|
Port of Embarkation
|
C = Cherbourg,
Q = Queenstown,
S = Southampton
|
2. Load Data:
3. Data Cleaning:
To keep this example simple, we are not going to add any new features. We will do the following cleanups instead:
- Remove a few variables which may not be beneficial for our analysis.
- Check for the NA values and replace the NA values with some meaningful data.
4. Create a Model:
To create our first Logistic Regression Model, we need to divide the dataset into Train and Test as we had earlier. We will use glm() (Generalized Linear Model) and Family= Binomial for this example.
5. Understand The Model:
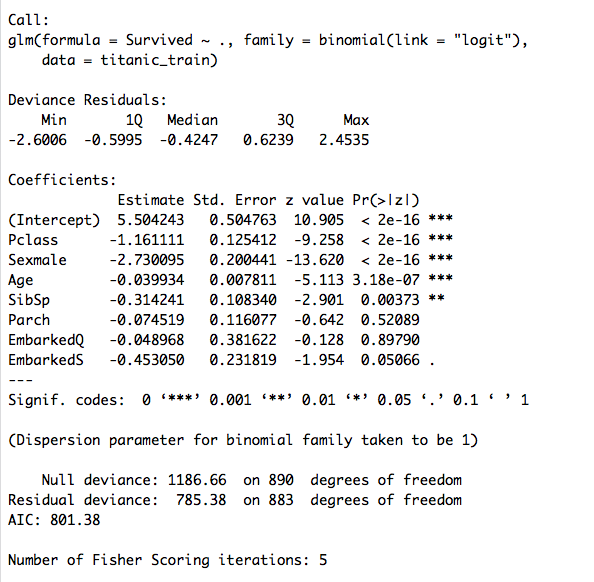
Let’s look at the Coefficients of the above Model and try to understand the meaning of the predictor variables.
- It looks like the variables “Pclass”,”Sex” and “Age” are highly significant in building the above Model. Predictor “SibSp” is also significant. But, “Parch” and “Embarked” has less or no significance at all in this Model.
- The Estimate column for all the variables is Negative. That means, for example, if all other variables being equal, the MALE passenger is less likely to have survived.
- The P-value is lowest for the Age variable and it signifies a strong association with the probability of being survived.
- AIC Value is the measure of the quality of the Model. The preferred model is the one with Minimum AIC Value.
6. Predict Survival for Test Data:
Now, let’s use the above Model to Predict Survival in the Test DataSet. To predict survival, we need to use the Predict().
If we check the summary of our prediction, it looks like the Minimum value is 0 and the Max value is 1. That means we are calculating the probability of survival of a passenger and the value is between 0 and 1. In this example, 156 passengers did survive and 262 passengers did not.
The Prediction value and the efficiency of the Model can be improved by adding some more features and trying adding or removing some variables. I have added my detailed analysis for Titanic Dataset in Github.
Thank You!


adreamoftrains best web hosting company
Very good post! We are linking to this particularly great post on our website.
Keep up the good writing. adreamoftrains best web hosting
website hosting services
Hey are using WordPress for your site platform? I’m new to
the blog world but I’m trying to get started and create my own.
Do you require any html coding knowledge to make your own blog?
Any help would be really appreciated!
Oindrila Sen
Yes, I am using BlueHost for hosting and WordPress for blogging.
Surya Informatics
At this time, it seems like Word Press is the preferred blogging platform available right now. (from what I’ve read) Is that what you’re using on your blog? Great post, however, I was wondering if you could write a little more on this subject?
Surya Informatics
Unknown
I think things like this are really interesting. I absolutely love to find unique places like this. It really looks super creepy though!! Best Machine Learning institute in Chennai | machine learning with python course in chennai | best training institute for machine learning